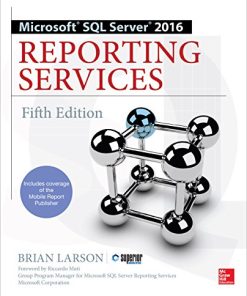
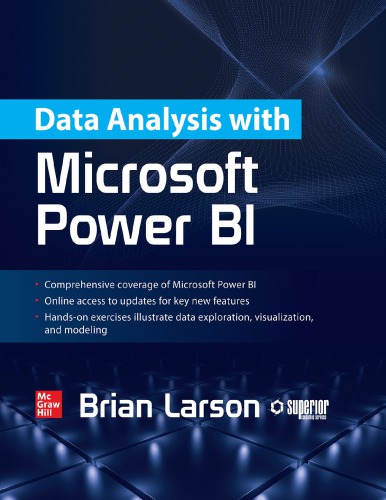
(Ebook PDF) Data Analysis with Microsoft Power Bi 1st edition by Brian Larson 126045861X 978-1260458619 full chapters
$50.00 Original price was: $50.00.$25.00Current price is: $25.00.
Data Analysis with Microsoft Power Bi 1st edition by Brian Larson – Ebook PDF Instant Download/DeliveryISBN: 126045861X, 978-1260458619
Full download Data Analysis with Microsoft Power Bi 1st edition after payment.
Product details:
ISBN-10 : 126045861X
ISBN-13 : 978-1260458619
Author : Brian Larson
Explore, create, and manage highly interactive data visualizations using Microsoft Power BI
Extract meaningful business insights from your disparate enterprise data using the detailed information contained in this practical guide. Written by a recognized BI expert and bestselling author, Data Analysis with Microsoft Power BI teaches you the skills you need to interact with, author, and maintain robust visualizations and custom data models. Hands-on exercises based on real-life business scenarios clearly demonstrate each technique. Publishing your results to the Power BI Service (PowerBI.com) and Power BI Report Server are also fully covered.
Data Analysis with Microsoft Power Bi 1st Table of contents:
Part I Understanding Business Intelligence and Power BI
Chapter 1 How to Use This Book
The Tool Chest Called Power BI
The BI Process
Power BI Parts and Pieces
The Right Tool(s) for the Job
Consuming Power BI Reports
Power BI as a Data Visualization Tool
Power BI as a Modeling Tool
Power BI as a Data Warehouse/Data Mart
Where to Find What You Need
Obtaining Power BI Desktop Software
Sample Code and Supporting Materials
Information on Power BI New Features and Enhancements
How to Succeed at Self-Service Analytics
Chapter 2 Successful Self-Service Analytics
What Is Business Intelligence?
Defining KPIs
Is Your Organization Ready for BI?
Desire
Realistic Expectations
Ongoing Care and Feeding
Well-Defined KPIs
Actionable KPIs
Reliable Sources of Data
Implementation: Best Practices
Take an Iterative Implementation Approach
Utilize a Data Warehouse/Data Mart
Cleanse and Validate During Data Gathering
Create User-Friendly Data Models
Publish Latency
Provide Training and Support
Use the Right Tool for the Job
Establish Standards and Limits
Successfully Using Power BI
Part II Interacting with Power BI
Chapter 3 Power BI Architecture
The Power BI Architecture
Power BI Desktop
The Power BI Service
The Power BI Report Server
The Power BI Mobile App
Power BI Desktop Optimizations
Power BI Updates
Microsoft On-premises Data Gateway
What Does the Data Have to Say?
Chapter 4 Using Power BI Visualizations
Power BI Desktop
Obtaining What You Need
Opening the Report/Preparing the Environment
Interacting with a Power BI Report
Working with a Single Report Item
Interacting with Multiple Report Items
Changing the Data with Slicers and Filters
Slicers
Filters
Navigating Power BI Reports
Drill Down and Drillthrough
Buttons
Bookmarks
Additional Data Interactions
A Cloudy Forecast
Chapter 5 Using the Power BI Service (PowerBI.com)
PowerBI.com
The Organization of PowerBI.com
Connecting to PowerBI.com
The Navigation Pane
Workspaces
Reports
Dashboards
Workbooks
Datasets
Dataflows
Additional Areas and Items Within PowerBI.com
Additional Navigation Pane Items
Additional Buttons
How It All Gets Made
Part III Creating Visualizations
Chapter 6 Basic Data Visualizations
Learn By Doing
Starting Point
Basic Visualizations
Maximum Miniatures Manufacturing
Our First Report Page
Text-based Visualizations
Graphical Visualizations
Interactivity
Slicers
Filters
Drillthrough
Geographic Visualizations
Bing Map Visualizations
Shape Map Visualizations
GIS Map Visualizations
Other Visual Elements
Text Boxes, Images, and Shapes
Fancy Formatting
Chapter 7 Visualization Formatting
The Visualization Format Tab
Report Page
All Items
Charts
Additional Chart Functional Groups
Table and Matrix
Card and Multi-row Card
Pie Chart, Donut Chart, Treemap, and Maps
Funnel
Gauge
KPI
Slicer
Button, Shape, and Image
Advanced Formatting Dialog Boxes
Conditional Formatting Advanced Controls Dialog Box
Data Bars Advanced Controls Dialog Box
The Visualization Analytics Tab
Types of Analytics Lines
Controls for Editing Analytics Lines
Themes
New Ways to Interact and Visualize
Chapter 8 Advanced Interactivity and Custom Visualizations
Controlling Interactivity
Controlling Interactions
Synchronizing Slicers
Creating Interactivity
Custom Tooltips
Bookmarks
Selection Pane
Buttons
Customizing Visualizations
Custom Visualizations from the Marketplace
Custom Visualizations from R and Python
Creating a Custom Shape Map
Moving on to Modeling
Part IV Building Data Models
Chapter 9 Loading Data with Power BI
Gathering Data
Get Data
Power BI Connection Types
Transforming Data During the Data Import
The Power BI Query Editor
A New Sample: World Population
Repeating and Changing the Data Import
Refreshing Data in Power BI Desktop
Modifying Queries
The Advanced Editor and the Power Query Formula Language
Data Source Permissions
Relationships and Intermediate Tables
Creating an Intermediate Table from a Data Source
Manually Creating Intermediate Tables
Parameters
Putting Parameters to Use
Transformers
Chapter 10 Power BI Transformation Reference
Transformation Reference
Informational-Only Transformations
Transformations on the Query Editor Home Tab
Transformations on the Query Editor Transform Tab
Transformations on the Query Editor Add Column Tab
Model Building
Chapter 11 Creating a Tabular Model in Power BI
Relationships
Creating Relationships
User-Friendly Models
Hiding Columns from the End User
Column Names and Descriptions
Formatting and Categories
One Final Relationship
Data Categories
Hierarchies, Groups, and Bins
Measuring Up
Chapter 12 Measures and Calculated Columns
Calculated Columns
Creating a Calculated Column
The Context for Calculated Columns
Measures
Default Summarization
Explicit Measures
Measures and Context
Defining Context Within a Measure
Time Analytics
Row-by-Row Calculations
The FILTER() Function
DAX Variables
Declaring DAX Variables and Assigning a Value
Using a DAX Variable
Using Return in a Measure
Everything DAX
Chapter 13 DAX Language Reference
DAX Operators
Comparison Operators
Arithmetic Operators
Text Operator
Logical Operators
DAX Functions
Modifying Context
Table-Valued Functions
Aggregate Functions
DAX Functions for Time Analytics
Parent/Child Relationships
Additional DAX Functions
Additional Modeling
Chapter 14 Additional Power BI Desktop Features
Additional Power BI Data Model Features
Synonyms
Linguistic Schemas
Display Folder
What-If Parameters
Roles
Performance Analyzer
Capturing Performance Information
Viewing the DAX Query
Import and Export
Excel Workbook Content
Power BI Templates
Spreading the Word
Part V Sharing Content
Chapter 15 Sharing Content on the Power BI Service (PowerBI.com)
The Power BI Service and Data Refresh
The On-premises Data Gateway
The On-premises Data Gateway Architecture
Installing the On-premises Data Gateway
Managing the On-premises Data Gateway
Managing the On-premises Data Gateway (personal mode)
Setting a Dataset for Scheduled Refresh
The Power BI Service and Sharing
Using Share
Using Content Packs
Using Apps
The Power BI Service and Row-Level Security
Assigning Users to a Custom Security Role
Another Way to Share
Chapter 16 Saving to the Power BI Report Server
Power BI Service and Power BI Report Server Comparison
Versions
Power BI Desktop Optimizations
Installing Power BI Report Server
The Power BI Report Server Installation Executable
The Report Server Configuration Manager
The Report Catalog
Folders
The Web Portal
Saving a Report to the Power BI Report Server
People also search for Data Analysis with Microsoft Power Bi 1st:
modern x86 assembly language programming pdf
modern x86 assembly language programming 3rd edition pdf
modern x86 assembly language programming by daniel kusswurm pdf
modern x86 assembly language programming 3rd edition
modern x86 assembly language programming github
Tags:
Data Analysis,Microsoft Power,Brian Larson,visualizations,technique
You may also like…
Computers - Enterprise Computing Systems
Computers - Organization and Data Processing
Computers - Programming
Computers - Algorithms and Data Structures
A Power BI Compendium: Answers to 65 Commonly Asked Questions on Power BI First Edition Alison Box
Uncategorized
Business & Economics - Personal Finance
Financial Analysis with Microsoft Excel 8th Edition Timothy R. Mayes
Computers - Applications & Software
Computers - Applications & Software
Uncategorized


