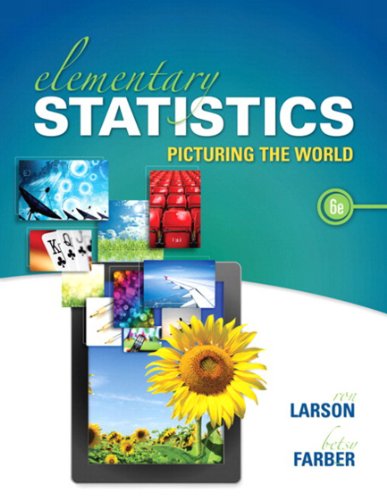
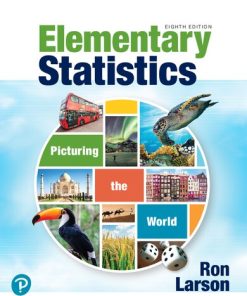
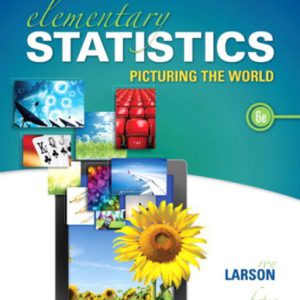
Elementary Statistics: Picturing the World 6th Edition, (Ebook PDF)
$50.00 Original price was: $50.00.$25.00Current price is: $25.00.
Elementary Statistics: Picturing the World 6th Edition, (Ebook PDF) – Digital Instant Dowload.
Elementary Statistics: Picturing the World 6th Edition, (Ebook PDF) – Digital Instant Dowload.
Product details:
- ISBN-10 : 0321901118
- ISBN-13 : 978-0321901118
- Author: Ron Larson (Author), Betsy Farber (Author)
Statistics opens a window to the modern world, and this market-leading text makes it easy to understand! Larson and Farber’s Elementary Statistics: Picturing the World, Sixth Edition, provides stepped out instruction, real-life examples and exercises, and the use of technology to offer the most accessible approach. The authors carefully develop theory through strong pedagogy, and examples show how statistics is used to picture and describe the world. In keeping with the premise that students learn best by doing, it includes more than 210 examples and more than 2300 exercises, to make the concepts of statistics a part of students’ everyday lives.
Table contents:
PART ONE. DESCRIPTIVE STATISTICS
1. Introduction to Statistics
1.1. An Overview of Statistics
1.2. Data Classification
Case Study: Rating Television Shows in the
United States
1.3. Data Collection and Experimental Design
2. Descriptive Statistics
2.1. Frequency Distributions and Their Graphs
2.2. More Graphs and Displays
2.3. Measures of Central Tendency
Activity: Mean Versus Median
2.4. Measures of Variation
Activity: Standard Deviation
Case Study: Business Size
2.5. Measures of Position
PART TWO. PROBABILITY & PROBABILITY DISTRIBUTIONS
3. Probability
3.1. Basic Concepts of Probability and Counting
Activity: Simulating the Stock Market
3.2. Conditional Probability and the Multiplication Rule
3.3. The Addition Rule
3.4. Additional Topics in Probability and Counting
4. Discrete Probability Distributions
4.1. Probability Distributions
4.2. Binomial Distributions
4.3. More Discrete Probability Distributions
5. Normal Probability Distributions
5.1. Introduction to Normal Distributions and the Standard Normal Distribution
5.2. Normal Distributions: Finding Probabilities
5.3. Normal Distributions: Finding Values
Case Study: Birth Rates in America
5.4. Sampling Distributions and the Central Limit Theorem
Activity: Sampling Distributions
5.5. Normal Approximations to Binomial Distributions
PART THREE. STATISTICAL INFERENCE
6. Confidence Intervals
6.1. Confidence Intervals for the Mean (¡ Known)
6.2. Confidence Intervals for the Mean (¡ Unknown)
Activity: Confidence Intervals for a Mean
Case Study: Marathon Training
6.3. Confidence Intervals for Population Proportions
Activity: Confidence Intervals for a Proportion
6.4. Confidence Intervals for Variance and Standard Deviation
7. Hypothesis Testing with One Sample
7.1. Introduction to Hypothesis Testing
7.2. Hypothesis Testing for the Mean (¡ Known)
7.3. Hypothesis Testing for the Mean (¡ Unknown)
7.4. Hypothesis Testing for Proportions
Activity: Hypothesis Test for a Proportion
7.5. Hypothesis Testing for Variance and Standard Deviation
8. Hypothesis Testing with Two Samples
8.1. Testing the Difference Between Means (Independent Samples, ¡1 and ¡2 Known)
8.2. Testing the Difference Between Means (Independent Samples, ¡1 and ¡2 Unknown)
8.3. Testing the Difference Between Means (Dependent Samples)
8.4. Testing the Difference Between Proportions
PART FOUR. MORE STATISTICAL INFERENCE
9. Correlation and Regression
9.1 Correlation
Activity: Correlation by Eye
9.2. Linear Regression
Activity: Regression by Eye
Case Study: Correlation by Body Measurements
9.3. Measures of Regression and Prediction Intervals
9.4. Multiple Regression
10. Chi-Square Tests and the F-Distribution
10.1. Goodness-of-Fit Test
10.2. Independence
Case Study: Food Safety Survey
10.3. Comparing Two Variances
10.4. Analysis of Variance
Cumulative Review: Chapters 9 and 10
11. Nonparametric Tests
11.1. The Sign Test
11.2. The Wilcoxon Tests
Case Study: College Ranks
11.3. The Kruskal-Wallis Test
11.4. Rank Correlation
11.5. The Runs Test
Research
You may also like…
Uncategorized
Uncategorized
Mathematics - Mathematical Statistics
Elementary Statistics: Picturing the World, 8e 8th Edition Ron Larson
Uncategorized


