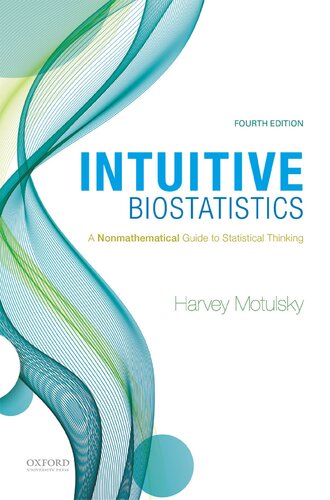
Intuitive Biostatistics A Nonmathematical Guide to Statistical Thinking 4th Edition by Harvey Motulsky 0190643591 9780190643591
$50.00 Original price was: $50.00.$25.00Current price is: $25.00.
Intuitive Biostatistics: A Nonmathematical Guide to Statistical Thinking 4th Edition by Harvey Motulsky – Ebook PDF Instant Download/DeliveryISBN: 0190643591, 9780190643591
Full download Intuitive Biostatistics: A Nonmathematical Guide to Statistical Thinking 4th Edition after payment.
Product details:
ISBN-10 : 0190643591
ISBN-13 : 9780190643591
Author: Harvey Motulsky
Intuitive Biostatistics takes a non-technical, non-quantitative approach to statistics and emphasizes interpretation of statistical results rather than the computational strategies for generating statistical data. This makes the text especially useful for those in health-science fields who have not taken a biostatistics course before. The text is also an excellent resource for professionals in labs, acting as a conceptually oriented and accessible biostatistics guide. With an engaging and conversational tone, Intuitive Biostatistics provides a clear introduction to statistics for undergraduate and graduate students and also serves as a statistics refresher for working scientists.
Intuitive Biostatistics: A Nonmathematical Guide to Statistical Thinking 4th Table of contents:
PRAISE FOR INTUITIVE BIOSTATISTICS
GREAT FOR SCIENTISTS
GREAT FOR STUDENTS
GREAT FOR EVERYONE
BRIEF CONTENTS
CONTENTS
PREFACE
WHO IS THIS BOOK FOR?
WHAT MAKES THE BOOK UNIQUE?
Nonmathematical
Statistical lingo
Includes topics omitted from many texts
Omits topics covered in most texts
A unique organization
WHAT’S NEW?
What was new in the second and third editions?
Overview of the fourth edition
List of new topics in the fourth edition
What happened to the problems and answers?
WHICH CHAPTERS ARE ESSENTIAL?
WHO HELPED?
WHO AM I?
ABBREVIATIONS
PART A. Introducing Statistics
CHAPTER 1. Statistics and Probability Are Not Intuitive
WE TEND TO JUMP TO CONCLUSIONS
WE TEND TO BE OVERCONFIDENT
WE SEE PATTERNS IN RANDOM DATA
WE DON’T REALIZE THAT COINCIDENCES ARE COMMON
WE DON’T EXPECT VARIABILITY TO DEPEND ON SAMPLE SIZE
WE HAVE INCORRECT INTUITIVE FEELINGS ABOUT PROBABILITY
WE FIND IT HARD TO COMBINE PROBABILITIES
WE DON’T DO BAYESIAN CALCULATIONS INTUITIVELY
WE ARE FOOLED BY MULTIPLE COMPARISONS
WE TEND TO IGNORE ALTERNATIVE EXPLANATIONS
WE ARE FOOLED BY REGRESSION TO THE MEAN
WE LET OUR BIASES DETERMINE HOW WE INTERPRET DATA
WE CRAVE CERTAINTY, BUT STATISTICS OFFERS PROBABILITIES
CHAPTER SUMMARY
TERM INTRODUCED IN THIS CHAPTER
CHAPTER 2. The Complexities of Probability
BASICS OF PROBABILITY
PROBABILITY AS LONG-TERM FREQUENCY
Probabilities as predictions from a model
Probabilities based on data
PROBABILITY AS STRENGTH OF BELIEF
Subjective probabilities
“Probabilities” used to quantify ignorance
Quantitative predictions of one-time events
CALCULATIONS WITH PROBABILITIES CAN BE EASIER IF YOU SWITCH TO CALCULATING WITH WHOLE NUMBERS
COMMON MISTAKES: PROBABILITY
Mistake: Ignoring the assumptions
Mistake: Trying to understand a probability without clearly defining both the numerator and the deno
Mistake: Reversing probability statements
Mistake: Believing that probability has a memory
LINGO
Probability vs. odds
Probability vs. statistics
Probability vs. likelihood
PROBABILITY IN STATISTICS
Q & A
CHAPTER SUMMARY
TERMS INTRODUCED IN THIS CHAPTER
CHAPTER 3. From Sample to Population
SAMPLING FROM A POPULATION
SAMPLING ERROR AND BIAS
MODELS AND PARAMETERS
MULTIPLE LEVELS OF SAMPLING
WHAT IF YOUR SAMPLE IS THE ENTIRE POPULATION?
CHAPTER SUMMARY
TERMS INTRODUCED IN THIS CHAPTER
PART B. Introducing Confidence Intervals
CHAPTER 4. Confidence Interval of a Proportion
DATA EXPRESSED AS PROPORTIONS
THE BINOMIAL DISTRIBUTION: FROM POPULATION TO SAMPLE
EXAMPLE: FREE THROWS IN BASKETBALL
EXAMPLE: POLLING VOTERS
ASSUMPTIONS: CI OF A PROPORTION
Assumption: Random (or representative) sample
Assumption: Independent observations
Assumption: Accurate data
WHAT DOES 95% CONFIDENCE REALLY MEAN?
A simulation
95% chance of what?
What is special about 95%?
ARE YOU QUANTIFYING THE EVENT YOU CARE ABOUT?
LINGO
CIs versus confidence limits
Estimate
Confidence level
Uncertainty interval
CALCULATING THE CI OF A PROPORTION
Several methods are commonly used
How to compute the modified Wald method by hand
Shortcut for proportions near 50%
Shortcut for proportions far from 50%
Shortcut when the numerator is zero: The rule of three
AMBIGUITY IF THE PROPORTION IS 0% OR 100%
AN ALTERNATIVE APPROACH: BAYESIAN CREDIBLE INTERVALS
COMMON MISTAKES: CI OF A PROPORTION
Mistake: Using 100 as the denominator when the value is a percentage
Mistake: Computing binomial CIs from percentage change in a continuous variable
Mistake: Computing a CI from data that look like a proportion but really is not
Mistake: Interpreting a Bayesian credible interval without knowing what prior probabilities (or prob
Q & A
CHAPTER SUMMARY
TERMS INTRODUCED IN THIS CHAPTER
CHAPTER 5. Confidence Interval of Survival Data
SURVIVAL DATA
CENSORED SURVIVAL DATA
CALCULATING PERCENTAGE SURVIVAL AT VARIOUS TIMES
GRAPHING SURVIVAL CURVES WITH CONFIDENCE BANDS
SUMMARIZING SURVIVAL CURVES
Median survival
Mean survival?
Five-year survival
ASSUMPTIONS: SURVIVAL ANALYSIS
Assumption: Random (or representative) sample
Assumption: Independent subjects
Assumption: Entry criteria are consistent
Assumption: End point defined consistently
Assumption: Starting time clearly defined
Assumption: Censoring is unrelated to survival
Assumption: Average survival doesn’t change during the study
Q & A
CHAPTER SUMMARY
TERMS INTRODUCED IN THIS CHAPTER
CHAPTER 6. Confidence Interval of Counted Data (Poisson Distribution)
THE POISSON DISTRIBUTION
ASSUMPTIONS: POISSON DISTRIBUTION
Assumptions for number of events
Assumptions for number of objects
CONFIDENCE INTERVALS BASED ON POISSON DISTRIBUTIONS
Raisins in bagels
Radioactive counts
Person-years
HOW TO CALCULATE THE POISSON CI
THE ADVANTAGE OF COUNTING FOR LONGER TIME INTERVALS (OR IN LARGER VOLUMES)
Q & A
CHAPTER SUMMARY
TERM INTRODUCED IN THIS CHAPTER
PART C. Continuous Variables
CHAPTER 7. Graphing Continuous Data
CONTINUOUS DATA
THE MEAN AND MEDIAN
LINGO: TERMS USED TO EXPLAIN VARIABILITY
Biological variability
Precision
Bias
Accuracy
Error
PERCENTILES
GRAPHING DATA TO SHOW VARIATION
Scatter plots
Box-and-whiskers plots
Violin plots
GRAPHING DISTRIBUTIONS
Frequency distributions
Cumulative frequency distribution
Cumulative frequency distribution
BEWARE OF DATA MASSAGE
Beware of filtering out impossible values
Beware of adjusting data
Beware of variables that are the ratio of two measurements
Beware of normalized data
Q & A
CHAPTER SUMMARY
TERMS INTRODUCED IN THIS CHAPTER
CHAPTER 8. Types of Variables
CONTINUOUS VARIABLES
Interval variables
Ratio variables
DISCRETE VARIABLES
Ordinal variables
Nominal and binomial variables
WHY IT MATTERS?
NOT QUITE AS DISTINCT AS THEY SEEM
Q & A
CHAPTER SUMMARY
TERMS INTRODUCED IN THIS CHAPTER
CHAPTER 9. Quantifying Scatter
INTERPRETING A STANDARD DEVIATION
HOW IT WORKS: CALCULATING SD
WHY n – 1?
When it sometimes makes sense to use n in the denominator
Why it usually makes sense to use n – 1 in the denominator
The fine print
SITUATIONS IN WHICH n CAN SEEM AMBIGUOUS
Replicate measurements within repeat experiments
Eyes, ears, and elbows
Representative experiments
Trials with one subject
SD AND SAMPLE SIZE
OTHER WAYS TO QUANTIFY AND DISPLAY VARIABILITY
Coefficient of variation
Variance
Interquartile range
Five-number summary
Median absolute deviation
Q & A
CHAPTER SUMMARY
TERMS INTRODUCED IN THIS CHAPTER
CHAPTER 10. The Gaussian Distribution
THE NATURE OF THE GAUSSIAN DISTRIBUTION
SD AND THE GAUSSIAN DISTRIBUTION
THE STANDARD NORMAL DISTRIBUTION
THE NORMAL DISTRIBUTION DOES NOT DEFINE NORMAL LIMITS
WHY THE GAUSSIAN DISTRIBUTION IS SO CENTRAL TO STATISTICAL THEORY
Q & A
CHAPTER SUMMARY
TERMS INTRODUCED IN THIS CHAPTER
CHAPTER 11.The Lognormal Distribution and Geometric Mean
THE ORIGIN OF A LOGNORMAL DISTRIBUTION
LOGARITHMS?
GEOMETRIC MEAN
GEOMETRIC SD
COMMON MISTAKES: LOGNORMAL DISTRIBUTIONS
Mistake: Being inconsistent with the use of common and natural logarithms
Mistake: Converting data to logarithms when some values are zero or negative
Mistake: Not recognizing a lognormal distribution and eliminating some high values as outliers
Q & A
CHAPTER SUMMARY
TERMS INTRODUCED IN THIS CHAPTER
CHAPTER 12. Confidence Interval of a Mean
INTERPRETING A CI OF A MEAN
WHAT VALUES DETERMINE THE CI OF A MEAN?
ASSUMPTIONS: CI OF A MEAN
Assumption: Random (or representative) sample
Assumption: Independent observations
Assumption: Accurate data
Assumption: Assessing an event you really care about
What if the assumptions are violated?
HOW TO CALCULATE THE CI OF A MEAN
MORE ABOUT CONFIDENCE INTERVALS
One-sided CIs
CI of the SD
CI of a geometric mean
The CI and the SEM
Q & A
CHAPTER SUMMARY
TERMS INTRODUCED IN THIS CHAPTER
CHAPTER 13. The Theory of Confidence Intervals
CI OF A MEAN VIA THE t DISTRIBUTION
What is the t distribution?
The critical value of t
The flip!
How it works
CI OF A MEAN VIA RESAMPLING
The resampling approach
Create many pseudosamples via resampling
The flip!
That’s it?
Learn more
CI OF A PROPORTION VIA RESAMPLING
CI OF A PROPORTION VIA BINOMIAL DISTRIBUTION
Q & A
CHAPTER SUMMARY
TERMS INTRODUCED IN THIS CHAPTER
CHAPTER 14. Error Bars
SD VERSUS SEM
What is the SD?
What is the SEM?
The SEM does not quantify the variability among values
The SEM quantifies how precisely you know the population mean
How to compute the SD from the SEM
WHICH KIND OF ERROR BAR SHOULD I PLOT?
Goal: To show the variation among the values
Goal: To show how precisely you have determined the population mean
Goal: To create persuasive propaganda
THE APPEARANCE OF ERROR BARS
HOW ARE SD AND SEM RELATED TO SAMPLE SIZE?
If you increase the sample size, is the SEM expected to get larger, get smaller, or stay about the s
If you increase the sample size, is the SD expected to get larger, get smaller, or stay about the sa
GEOMETRIC SD ERROR BARS
COMMON MISTAKES: ERROR BARS
Mistake: Plotting mean and error bar instead of plotting a frequency distribution
Mistake: Assuming that all distributions are Gaussian
Mistake: Plotting a mean and error bar without defining how the error bars were computed
Q & A
CHAPTER SUMMARY
TERMS INTRODUCED IN THIS CHAPTER
PART D. P Values and Statistical Significance
CHAPTER 15. Introducing P Values
INTRODUCING P VALUES
EXAMPLE 1: COIN FLIPPING
Calculating the P value
Interpreting the P value
EXAMPLE 2: ANTIBIOTICS ON SURGICAL WOUNDS
EXAMPLE 3: ANGIOPLASTY AND MYOCARDIAL INFARCTION
LINGO: NULL HYPOTHESIS
WHY P VALUES ARE CONFUSING
ONE- OR TWO-TAILED P VALUE?
Example 1: Coin flipping
Example 2: Antibiotics on Surgical Wounds
What is the advantage of a one-tailed P value?
When is a one-tailed P value appropriate?
The problem with one-tailed P values
When in doubt, use two-tailed P values
P VALUES ARE NOT VERY REPRODUCIBLE
THERE IS MUCH MORE TO STATISTICS THAN P VALUES
COMMON MISTAKES: P VALUES
The most common misconception about P values
The P value is not the probability that the result was due to sampling error
The P value is not the probability that the null hypothesis is true
The probability that the alternative hypothesis is true is not 1.0 minus the P value
The probability that the results will hold up when the experiment is repeated is not 1.0 minus the P
A high P value does not prove that the null hypothesis is true
“P = 0.05” is not the same as “P < 0.05”
A P value does not always have to be written as an inequality
The P value tests more than the null hypothesis
Q & A
CHAPTER SUMMARY
TERMS INTRODUCED IN THIS CHAPTER
CHAPTER 16. Statistical Significance and Hypothesis Testing
STATISTICAL HYPOTHESIS TESTING
ANALOGY: INNOCENT UNTIL PROVEN GUILTY
Scientist as juror
Scientist as journalist
EXTREMELY SIGNIFICANT? BORDERLINE SIGNIFICANT?
Tiny P values
Borderline statistical significance
LINGO: TYPE I AND TYPE II ERRORS
Type I error
Type II error
A worse kind of error
You won’t know
TRADEOFFS WHEN CHOOSING A SIGNIFICANCE LEVEL
The distinction between the P value and α
The trade-off
Example: Detecting spam
Example: Trial by jury
Example: Detecting athletes that dope
WHAT SIGNIFICANCE LEVEL SHOULD YOU CHOOSE?
P < 0.05?
P < 0.005?
P < 0.0000003?
Choose and justify the significance level
INTERPRETING A CI, A P VALUE, AND A HYPOTHESIS TEST
STATISTICAL SIGNIFICANCE VS. SCIENTIFIC SIGNIFICANCE
COMMON MISTAKES: STATISTICAL HYPOTHESIS TESTING
Mistake: Believing that statistical hypothesis testing is an essential part of all statistical analy
Mistake: Believing that if a result is statistically significant, the effect must be large
Mistake: Not realizing how fragile statistical significance can be
Mistake: P-hacking to obtain statistical significance
Q & A
CHAPTER SUMMARY
TERMS DEFINED IN THIS CHAPTER
CHAPTER 17. Comparing Groups with Confidence Intervals and P Values
CIS AND STATISTICAL HYPOTHESIS TESTING ARE CLOSELY RELATED
When a CI includes the null hypothesis
When a CI does not include the null hypothesis
A rule that links CIs and statistical significance
FOUR EXAMPLES WITH CIS, P VALUES, AND CONCLUSION ABOUT STATISTICAL SIGNIFICANCE
Example 1: Does apixaban prevent thromboembolism?
Background
CI
P value
Statistical significance
Example 2: Is the maximal bladder relaxation different in old and young rats?
Background
CI
P value
Statistical significance
Example 3: Do selective serotonin reuptake inhibitors increase the risk of autism?
CI
P Value and statistical significance
Example 4: Does tight hyperglycemic control benefit children in intensive care?
CI
P value and statistical significance
Q & A
CHAPTER SUMMARY
CHAPTER 18. Interpreting a Result That IsStatistically Significant
SEVEN EXPLANATIONS FOR RESULTS THAT ARE “STATISTICALLY SIGNIFICANT”
Explanation 1: The drug had a substantial effect
Explanation 2: The drug had a trivial effect
Explanation 3: The result is a false positive, also called a Type I error or false discovery
Explanation 4: There was a Type S error
Explanation 5: The experimental design was poor
Explanation 6: The results cannot be interpreted due to ad hoc multiple comparisons
Explanation 7: The results cannot be interpreted due to dynamic sample size
Bottom line: When a P value is small, consider all the possibilities
HOW FREQUENTLY DO TYPE I ERRORS (FALSE POSITIVES) OCCUR?
What is a Type I error?
The significance level (α)
The False Positive Report Probability
The FPRP and the significance level are not the same
THE PRIOR PROBABILITY INFLUENCES THE FPRP (A BIT OF BAYES)
Example 1: Prior probability = 0%
Example 2: Prior probability = 1%
Example 3: Prior probability = 10%
Example 4: Prior probability = 50%
Example 5: Prior probability = 100%
The FPRP when the P value is just a tiny bit less than 0.05
The FPRP is even higher when the power is low
What if you can’t estimate the prior probability?
BAYESIAN ANALYSIS
ACCOUNTING FOR PRIOR PROBABILITY INFORMALLY
THE RELATIONSHIP BETWEEN SAMPLE SIZE AND P VALUES
COMMON MISTAKES
Mistake: Believing that a “statistically significant” result proves an effect is real
Mistake: Believing that if a difference is “statistically significant,” it must have a large phy
Mistake: Asking about the chance of a Type I error without any clarifying details
Mistake: Thinking that the FPRP equals the significance level
Mistake: Not realizing that the FPRP depends on the scientific context
Mistake: Thinking that a P value just barely less than 0.05 is strong evidence against the null hypo
Mistake: Focusing on one P value
Q & A
CHAPTER SUMMARY
TERMS INTRODUCED IN THIS CHAPTER
CHAPTER 19. nterpreting a Result That Is Not Statistically Significant
FIVE EXPLANATIONS FOR “NOT STATISTICALLY SIGNIFICANT” RESULTS
Explanation 1: The drug did not affect the enzyme you are studying
Explanation 2: The drug had a trivial effect
Explanation 3: There was a Type II error
Explanation 4: The experimental design was poor
Explanation 5: The results cannot be interpreted due to dynamic sample size
“NOT SIGNIFICANTLY DIFFERENT” DOES NOT MEAN “NO DIFFERENCE”
EXAMPLE: α2-ADRENERGIC RECEPTORS ON PLATELETS
EXAMPLE: FETAL ULTRASOUNDS
HOW TO GET NARROWER CIS
WHAT IF THE P VALUE IS REALLY HIGH?
Q & A
CHAPTER SUMMARY
CHAPTER 20. Statistical Power
WHAT IS STATISTICAL POWER?
DISTINGUISHING POWER FROM BETA AND THE FALSE POSITIVE REPORT RATE
AN ANALOGY TO UNDERSTAND STATISTICAL POWER
POWER OF THE TWO EXAMPLE STUDIES
WHEN DOES IT MAKE SENSE TO COMPUTE POWER?
COMMON MISTAKES: POWER
People also search for Intuitive Biostatistics: A Nonmathematical Guide to Statistical Thinking 4th:
intuitive biostatistics
intuitive biostatistics pdf
intuitive biostatistics 4th edition
intuitive biostatistics a nonmathematical guide to statistical thinking
intuitive biostatistics 4th edition pdf
Tags: Intuitive Biostatistics, A Nonmathematical Guide, Statistical Thinking, Harvey Motulsky
You may also like…
Politics & Philosophy - Anthropology
Languages - Rhetoric
The College Writer: A Guide to Thinking, Writing, and Researching 7th Edition John Van Rys
Mathematics - Mathematical Statistics
Uncategorized
Science (General)
Reference - Writing


