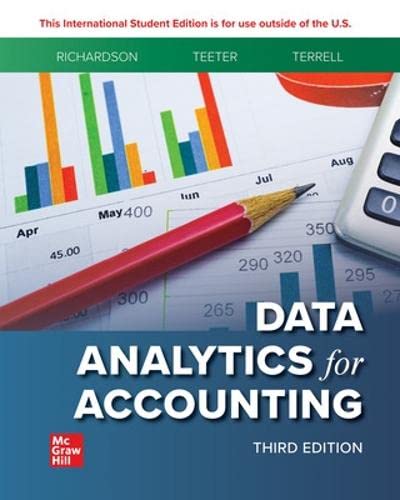
(EBook PDF) ISE Data Analytics for Accounting 3rd Edition by Vernon Richardson Professor 1264460570 9781264460571 full chapters
$50.00 Original price was: $50.00.$25.00Current price is: $25.00.
ISE Data Analytics for Accounting 3rd Edition by Vernon Richardson Professor – Ebook PDF Instant Download/DeliveryISBN: 1264460570, 9781264460571
Full download ISE Data Analytics for Accounting 3rd Edition after payment
Product details:
ISBN-10 : 1264460570
ISBN-13 : 9781264460571
Author: Vernon Richardson Professor
Data Analytics is changing the business world—data simply surrounds us which means all accountants must develop data analytic skills to address the needs of the profession in the future. Data Analytics for Accounting 3e is designed to prepare your students with the necessary tools and skills they need to successfully perform data analytics through a conceptual framework and hands-on practice with real-world data. Using the IMPACT Cycle the authors provide a conceptual framework to help students think through the steps needed to provide data-driven insights and recommendations. Once students understand the foundation of providing data-driven insights they are then provided hands-on practice with real-world data sets and various data analysis tools which students will use throughout the rest of their career. The data analysis tools are structured around two tracks—the Microsoft track (Excel Power Pivot and Power BI) and a Tableau track (Tableau Prep and Tableau Desktop). Using multiple tools allows students to learn which tool is best suited for the necessary data analysis data visualization and communication of the insights gained. Data Analytics for Accounting 3e is a full-course data analytics solution guaranteed to prepare your students for their future careers as accountants.
ISE Data Analytics for Accounting 3rd Table of contents:
Chapter 1: Data Analytics in Accounting and Identifying the Questions
Introduction
A Look at This Chapter
A Look Ahead
Data Analytics
How Data Analytics Affects Business
How Data Analytics Affects Accounting
Auditing
Management Accounting
Financial Reporting and Financial Statement Analysis
Tax
The Data Analytics Process Using the Impact Cycle
Step 1: Identify the Questions (Chapter 1)
Step 2: Master the Data (Chapter 2)
Step 3: Perform Test Plan (Chapter 3)
Step 4: Address and Refine Results (Chapter 3)
Steps 5 and 6: Communicate Insights and Track Outcomes (Chapter 4 and each chapter thereafter)
Back to Step 1
Data-Analytic Skills and Tools Needed by Analytic-Minded Accountants
Hands-On Example of the Impact Model
Identify the Questions
Master the Data
Perform Test Plan
Address and Refine Results
Communicate Insights
Track Outcomes
Summary
Key Words
Answers to Progress Checks
Multiple Choice Questions
Discussion and Analysis
Problems
Lab 1-0 How to Complete Labs in This Text
Lab 1-0 Part 1 Explore Different Tool Tracks
Lab 1-0 Part 2 Take Screenshots of Your Tools
Lab 1-1 Data Analytics Questions in Financial Accounting
Lab 1-1 Part 1 Identify the Questions
Lab 1-1 Part 2 Master the Data
Lab 1-2 Data Analytics Questions in Managerial Accounting
Lab 1-2 Part 1 Identify the Questions
Lab 1-2 Part 2 Master the Data
Lab 1-3 Data Analytics Questions in Auditing
Lab 1-3 Part 1 Identify the Questions
Lab 1-3 Part 2 Master the Data
Lab 1-4 Comprehensive Case: Questions about Dillard’s Store Data
Lab 1-4 Part 1 Identify the Questions
Lab 1-4 Part 2 Master the Data
Lab 1-5 Comprehensive Case: Connect to Dillard’s Store Data
Lab 1-5 Part 1 Load the Dillard’s Data in Excel+ Power Query and Tableau Prep
Lab 1-5 Part 2 Tableau Desktop and Power BI Desktop
Chapter 2: Mastering the Data
Introduction
A Look at This Chapter
A Look Back
A Look Ahead
How Data Are Used and Stored in the Accounting Cycle
Internal and External Data Sources
Accounting Data and Accounting Information Systems
Data and Relationships in a Relational Database
Columns in a Table: Primary Keys, Foreign Keys, and Descriptive Attributes
Data Dictionaries
Extract, Transform, and Load (ETL) the Data
Extract
Transform
Load
Ethical Considerations of Data Collection and Use
Summary
Key Words
Answers to Progress Checks
Multiple Choice Questions
Discussion and Analysis
Problems
Lab 2-1 Request Data from IT—Slainte
Lab 2-1 Part 1 Identify the Questions and Generate a Data Request
Lab 2-1 Part 2 Evaluate the Data Extract
Lab 2-2 Prepare Data for Analysis—Slainte
Lab 2-2 Example Output
Lab 2-2 Part 1 Prepare a Data Model
Lab 2-2 Part 2 Validate the Data
Lab 2-3 Resolve Common Data Problems—LendingClub
Lab 2-3 Example Output
Lab 2-3 Part 1 Identify Relevant Attributes
Lab 2-3 Part 2 Transform and Clean the Data
Lab 2-4 Generate Summary Statistics—LendingClub
Lab 2-4 Example Output
Lab 2-4 Calculate Summary Statistics
Lab 2-5 Validate and Transform Data—College Scorecard
Lab 2-5 Example Output
Lab 2-5 Load and Clean Data
Lab 2-6 Comprehensive Case: Build Relationships among Database Tables—Dillard’s
Lab 2-6 Example Output
Lab 2-6 Build Relationships between Tables
Lab 2-7 Comprehensive Case: Preview Data from Tables—Dillard’s
Lab 2-7 Example Output
Lab 2-7 Part 1 Preview Dillard’s Attributes and Data Types
Lab 2-7 Part 2 Explore Dillard’s Data More In-Depth
Lab 2-8 Comprehensive Case: Preview a Subset of Data in Excel, Tableau Using a SQL Query—Dillard’s
Lab 2-8 Example Output
Lab 2-8 Part 1 Connect to the Data with a SQL Query
Lab 2-8 Part 2 View the Distribution of Transaction Amounts across States
Chapter 3: Performing the Test Plan and Analyzing the Results
Introduction
A Look at This Chapter
A Look Back
A Look Ahead
Performing the Test Plan
Descriptive Analytics
Summary Statistics
Data Reduction
Diagnostic Analytics
Standardizing Data for Comparison (Z-score)
Profiling
Cluster Analysis
Hypothesis Testing for Differences in Groups
Predictive Analytics
Regression
Classification
P-Values versus Effect Size
Prescriptive Analytics
Decision Support Systems
Machine Learning and Artificial Intelligence
Summary
Key Words
Answers to Progress Checks
Multiple Choice Questions
Discussion and Analysis
Problems
Appendix: Setting Up a Classification Analysis
Identify Your Variables
Define the Scope
Distance Formula
Assign Classes
Lab 3-1 Descriptive Analytics: Filter and Reduce Data—Slainte
Lab 3-1 Example Output
Lab 3-1 Match Suppliers and Employees with Similar Addresses
Lab 3-2 Diagnostic Analytics: Identify Data Clusters—Lending Club
Lab 3-2 Example Output
Lab 3-2 Cluster Analysis of Borrowers
Lab 3-3 Predictive Analytics: Perform a Linear Regression Analysis—College Scorecard
Lab 3-3 Example Output
Lab 3-3 Prepare Your Data and Create a Linear Regression
Lab 3-4 Comprehensive Case: Descriptive Analytics: Generate Summary Statistics—Dillard’s
Lab 3-4 Example Output
Lab 3-4 Calculate and Compare Summary Statistics
Lab 3-5 Comprehensive Case: Diagnostic Analytics: Compare Distributions—Dillard’s
Lab 3-5 Example Output
Lab 3-5 Part 1 Prepare the Data and Compare the Distributions of Online Sales and In-Person Sales
Lab 3-5 Part 2 Run the Hypothesis Test
Lab 3-6 Comprehensive Case: Create a Data Abstract and Perform Regression Analysis—Dillard’s
Lab 3-6 Example Output
Lab 3-6 Part 1 Perform an Analysis of the Data
Lab 3-6 Part 2 Extend the Predictive Model to Include an Additional Explanatory Variable
Chapter 4: Communicating Results and Visualizations
Introduction
A Look at This Chapter
A Look Back
A Look Ahead
Communicating Results
Differentiating between Statistics and Visualizations
Visualizations Increasingly Preferred over Text
Determine the Purpose of Your Data Visualization
Quadrants 1 and 3 versus Quadrants 2 and 4: Qualitative versus Quantitative
A Special Case of Quantitative Data: The Normal Distribution
Quadrants 1 and 2 versus Quadrants 3 and 4: Declarative versus Exploratory
Choosing the Right Chart
Charts Appropriate for Qualitative Data
Charts Appropriate for Quantitative Data
Learning to Create a Good Chart by (Bad) Example
Further Refining Your Chart to Communicate Better
Data Scale and Increments
Color
Communication—More Than Visuals, Using Words to Provide Insights
Content and Organization
Audience and Tone
Revising
Summary
Key Words
Answers to Progress Checks
Multiple Choice Questions
Discussion and Analysis
Problems
Lab 4-1 Visualize Declarative Data—Slainte
Lab 4-1 Example Output
Lab 4-1 Part 1 Total Sales Revenue by Product and Location
Lab 4-1 Part 2 Total Sales Volume by Month and Target
Lab 4-2 Visualize Exploratory Data—Slainte
Lab 4-2 Example Output
Lab 4-2 Total Sales by Customer
Lab 4-3 Create Dashboards—LendingClub
Lab 4-3 Example Output
Lab 4-3 Part 1 Summarize Loan Data
Lab 4-3 Part 2 Dig Deeper into Loan Data
Lab 4-4 Comprehensive Case: Visualize Declarative Data—Dillard’s
Lab 4-4 Example Output
Lab 4-4 Part 1 Compare In-Person Transactions across States (Sum and Average)
Lab 4-4 Part 2 Compare Online Transactions across States (Sum and Average)
Lab 4-5 Comprehensive Case: Visualize Exploratory Data—Dillard’s
Lab 4-5 Example Output
Lab 4-5 Part 1 Identify the Texas Store with the Highest Revenue
Lab 4-5 Part 2 Explore the Department Hierarchy and Compare Revenue across Departments
Chapter 5: The Modern Accounting Environment
Introduction
A Look at This Chapter
A Look Back
A Look Ahead
The Modern Data Environment
The Increasing Importance of the Internal Audit
Enterprise Data
Common Data Models
Automating Data Analytics
Continuous Monitoring Techniques
ALARMS AND EXCEPTIONS
Working Papers and Audit Work Flow
Electronic Working Papers and Remote Audit Work
Summary
Key Words
Answers to Progress Checks
Multiple Choice Questions
Discussion and Analysis
Problems
Lab 5-1 Create a Common Data Model—Oklahoma
Lab 5-1 Example Output
Lab 5-1 Transform Data to Match the Audit Data Standard
Lab 5-2 Create a Dashboard Based on a Common Data Model—Oklahoma
Lab 5-2 Example Output
Lab 5-2Create a Dashboard
Lab 5-3 Set Up a Cloud Folder and Review Changes—Slainte
Lab 5-3 Example Output
Lab 5-3 Part 1 Set Up a Cloud Folder
Lab 5-3 Part 2 Review Changes to Working Papers
Lab 5-4 Identify Audit Data Requirements—Slainte
Lab 5-4 Example Output
Lab 5-4 Part 1 Look for Audit Procedures That Evaluate Data
Lab 5-4 Part 2 Set the Frequency of Your Audit Procedures
Lab 5-5 Comprehensive Case: Setting Scope—Dillard’s
Lab 5-5 Example Output
Lab 5-5 Part 1 Explore the Data
Lab 5-5 Part 2 Filter Data
Chapter 6: Audit Analytics
Introduction
A Look at This Chapter
A Look Back
A Look Ahead
When to Use Audit Data Analytics
Identify the Questions
Master the Data
Perform Test Plan
Address and Refine Results
Communicate Insights
Track Outcomes
Descriptive Analytics
Aging of Accounts Receivable
Sorting
Summary Statistics
Sampling
Diagnostic Analytics
Box Plots andQuartiles
Z-score
t-Tests
Benford’s Law
Drill-Down
Exact and Fuzzy Matching
Sequence Check
Stratification and Clustering
Advanced Predictive and Prescriptive Analytics
Regression
Classification
Probability
Sentiment Analysis
Applied Statistics
Artificial Intelligence
Additional Analyses
Summary
Key Words
Answers to Progress Checks
Multiple Choice Questions
Discussion and Analysis
Problems
Lab 6-1 Evaluate Trends and Outliers—Oklahoma
Lab 6-1 Example Output
Lab 6-1 Part 1 Identify Purchase Trends over Time
Lab 6-1 Part 2 Cluster Analysis of Borrowers
Lab 6-2 Diagnostic Analytics Using Benford’s Law—Oklahoma
Lab 6-2 Example Output
Lab 6-2 Applying Benford’s Law to Purchase Transactions and Individuals
Lab 6-3 Finding Duplicate Payments—Slainte
Lab 6-3 Example Output
Lab 6-3 Identify Matching Fields for Duplicates
Lab 6-4 Comprehensive Case: Sampling—Dillard’s
Lab 6-4 Example Output
Lab 6-4 Sampling Analysis
Lab 6-5 Comprehensive Case: Outlier Detection—Dillard’s
Lab 6-5 Example Output
Lab 6-5 Part 1 Compare Actual Leading Digits to Expected Leading Digits
Lab 6-5 Part 2 Construct Fictitious Data and Assess It for Outliers
Lab 6-5 Part 3 Test the Distributions for Statistical Significance
Chapter 7: Managerial Analytics
Introduction
A Look at This Chapter
A Look Back
A Look Ahead
Application of IMPACT to Management Accounting Questions
Identify the Questions
Master Data
Perform the Test Plan
Address and Refine Results
Communicate Insights and Track Outcomes
Identifying Management Accounting Questions
Relevant Costs
Key Performance Indicators and Variance Analysis
Cost Behavior
Balanced Scorecard and Key Performance Indicators
Master The Data And Perform The Test Plan
Address and Refine Results
Summary
Key Words
Answers to Progress Checks
Multiple Choice Questions
Discussion and Analysis
Problems
Lab 7-1 Evaluate Job Costs—Slainte
Lab 7-1 Example Output
Lab 7-1 Part 1 Calculate Revenues and Costs
Lab 7-1 Part 2 Identify the Composition of Each Job’s Revenue
Lab 7-1 Part 3 Evaluate Variances in Different Cost Components
Lab 7-2 Create a Balanced Scorecard Dashboard—Slainte
Lab 7-2 Example Output
Lab 7-2 Part 1 Identify KPI Targets and Colors
Lab 7-2 Part 2 Balanced Scorecard Dashboard
Lab 7-3 Comprehensive Case: Analyze Time Series Data—Dillard’s
Lab 7-3 Example Output
Lab 7-3 Part 1 Create a Highlight Table and Cycle Plot (Tableau), Sparklines (Excel)
Lab 7-3 Part 2 Add Additional Visualizations and Filters (Tableau), Slicers (Excel)
Lab 7-3 Part 3 Re-create the Monthly Dashboard as a Weekday Dashboard
Lab 7-3Part 4 Create KPIs in Excel to Compare Sales Performance to Prior and Previous Time Periods
Lab 7-4 Comprehensive Case: Compare Results to a Prior Period—Dillard’s
Lab 7-4 Example Output
Lab 7-4 Part 1 Setup Parameters and Calculated Fields
Lab 7-4 Part 2 Compare Store Results to Global KPI Target
Lab 7-4 Part 3 Compare Current Year Results to Previous Year Results
Lab 7-5 Comprehensive Case: Create Advanced Performance Models—Dillard’s
Lab 7-5 Example Output
Lab 7-5 Part 1 Cluster Analysis of High-Volume Stores
Lab 7-5 Part 2 Stacked Bar Chart of Daily Store Performance
Lab 7-5 Part 3 Tree Map of Sales by Location
Chapter 8: Financial Statement Analytics
Introduction
A Look at This Chapter
A Look Back
A Look Ahead
Financial Statement Analysis
Descriptive Financial Analytics
Vertical and Horizontal Analysis
Ratio Analysis
Diagnostic Financial Analytics
Predictive Financial Analytics
Prescriptive Financial Analytics
Visualizing Financial Data
Showing Trends
Relative Size of Accounts Using Heat Maps
Visualizing Hierarchy
Text Mining and Sentiment Analysis
XBRL and Financial Data Quality
XBRL Data Quality
XBRL, XBRL-GL, and Real-Time Financial Reporting
Examples of Financial Statement Analytics Using XBRL
Summary
Key Words
Answers to Progress Checks
Multiple Choice Questions
Discussion and Analysis
Problems
Lab 8-1 Create a Horizontal and Vertical Analysis Using XBRL Data—S&P100
Lab 8-1 Example Output
Lab 8-1 Part 1 Connect to Your Data
Lab 8-1 Part 2 Look Up Data and Perform Analysis
Lab 8-2 Create Dynamic Common Size Financial Statements—S&P100
Lab 8-2 Example Output
Lab 8-2 Identify the Mystery Companies
Lab 8-3 Analyze Financial Statement Ratios—S&P100
Lab 8-3 Example Output
Lab 8-3 Load and Evaluate Financial Ratios
Lab 8-4 Analyze Financial Sentiment—S&P100
Lab 8-4 Example Output
Lab 8-4 Part 1 Filters and Calculations
Lab 8-4 Part 2 Sentiment Analysis Dashboard
Chapter 9: Tax Analytics
Introduction
A Look at This Chapter
A Look Back
A Look Forward
Tax Analytics
Identify the Questions
Master the Data
Perform Test Plan
Address and Refine Results
Communicate Insights and Track Outcomes
Mastering the Data Through Tax Data Management
Tax Data in the Tax Department
Tax Data at Accounting Firms
Tax Data at the IRS
Tax Data Analytics Visualizations
Tax Data Analytics Visualizations and Tax Compliance
Evaluating Sales Tax Liability
Evaluating Income Tax Liability
Tax Data Analytics for Tax Planning
What-If Scenarios
What-If Scenarios for Potential Legislation, Deductions, and Credits
Summary
Key Words
Answers to Progress Checks
Multiple Choice Questions
Discussion and Analysis
Problems
Lab 9-1 Descriptive Analytics: State Sales Tax Rates
Lab 9-1 Example Output
Lab 9-1 Create a Histogram and a Filled Map to Assess the Distribution of State Sales Tax Rates
Lab 9-2 Comprehensive Case: Calculate State Sales Tax—Dillard’s
Lab 9-2 Example Output
Lab 9-2 Calculate Estimated State Sales Tax Owed in 2015 by Dillard’s
Lab 9-3 Comprehensive Case: Calculate Total Sales Tax Paid—Dillard’s
Lab 9-3 Example Output
Lab 9-3 Part 1 Calculate Sales Tax Paid in 2015 by Dillard’s
Lab 9-3 Part 2 Compare Actual Sales Tax Paid in 2015 with the Estimated Sales Tax Paid
Lab 9-4 Comprehensive Case: Estimate Sales Tax Owed by Zip Code—Dillard’s and Avalara
Lab 9-4 Example Output
Lab 9-4 Part 1 Combine and Explore the Avalara Tax Rate Data
Lab 9-4 Part 2 Merge the Avalara Tax Data with the Dillard’s Data
Lab 9-5 Comprehensive Case: Online Sales Taxes Analysis—Dillard’s and Avalara
Lab 9-5 Example Output
Lab 9-5 Combine the Avalara Tax Rate Data and Merge with Dillard’s Data
Chapter 10: Project Chapter Basic
Introduction
A Look at This Chapter
A Look Back
A Look Forward
Evaluating Business Processes
Question Set 1: Order-to-Cash
QS1 Part 1 Financial: What Is the Total Revenue and Balance in Accounts Receivable?
QS1 Part 2 Managerial: How Efficiently Is the Company Collecting Cash?
QS1 Part 3 Audit: Is the Delivery Process Following the Expected Procedure?
QS1 Part 4 What Else Can You Determine about the O2C Process?
Question Set 2: Procure-to-Pay
QS2 Part 1 Financial: Is the Company Missing Out on Discounts by Paying Late?
QS2 Part 2 Managerial: How Long Is the Company Taking to Pay Invoices?
QS2 Part 3 Audit: Are There Any Erroneous Payments?
QS2 Part 4 What Else Can You Determine about the P2P Process?
Chapter 11: Project Chapter Advanced: Analyzing Dillard’s Data to Predict Sales Returns
Introduction
A Look at This Chapter
A Look Back
Estimating Sales Returns
Question Set 1: Descriptive and Exploratory Analysis
QS1 Part 1 Compare the Percentage of Returned Sales across Months, States, and Online versus. In-Person Transactions
QS1 Part 2What Else Can You Determine about the Percentage of Returned Sales through Descriptive Analysis?
Question Set 2: Diagnostic Analytics—Hypothesis Testing
QS2 Part 1 Is the Percentage of Sales Returned Significantly Higher in January after the Holiday Season?
QS2 Part 2 How Do the percentages of Returned Sales for Holiday/Non-Holiday Differfor Online Transactions and across Different States?
QS2 Part 3What Else Can You Determine about the percentage of Returned Sales through Diagnostic Analysis?
Question Set 3: Predictive Analytics
QS3 Part 1 By Looking at Line Charts for 2014 and 2015, Does the Average Percentage of Sales Returned in 2014 Seem to Be Predictive of Returns in 2015?
QS3 Part 2 Using Regression, Can We Predict Future Returns as a Percentage of Sales Based on Historical Transactions?
QS3 Part 3 What Else Can You Determine about the Percentage of Returned Sales through Predictive Analysis?
Appendix A: Basic Statistics Tutorial
Appendix A: Basic Statistics Tutorial
Population vs. Sample
Parameters vs. Statistics: What Is the Difference?
Describing the Sample by Its Central Tendency, the Middle, or Most Typical Value
Describing the Spread (or Variability) of the Data
Probability Distributions
Hypothesis Testing
Statistical Testing
Interpreting the Statistical Output from a Sample t-Test of a Difference of Means of Two Groups
Interpreting the Statistical Output from a Regression
Appendix B: Excel Basics (Formatting, Sorting, Filtering, and PivotTables)
Appendix B: Excel (Formatting, Sorting, Filtering, and PivotTables)
Basic Formatting of an Income Statement using Excel Function SUM()
Basic Data Manipulation (Filters, Sorts, PivotTables)
The VLOOKUP Function
Appendix C: Accessing the Excel Data Analysis Toolpak
Appendix C: Accessing the Excel Data Analysis Toolpak
Appendix D: SQL Part 1
Appendix D: SQL Part 1
Introduction to SQL Clauses
Expanding the Usage of SELECT
Extending the Query with GROUP BY and HAVING Clauses
Extending the Use of the FROM Clause: SELECTing Data from More Than One Table
Putting It All Together
Appendix E: SQL Part 2
Appendix E: SQL Part 2
Explanation of Inner Joins
Explanation of Left Joins
Explanation of Right Joins
Appendix F: Power Query in Excel and Power BI
Appendix F: Power Query in Excel and Power BI
Connect to SQL Server
Power BI & Excel: Editing the Data in Power Query
After Loading the Data into Power BI or Excel: How to Continue Working with Your Data
Appendix G: Power BI Desktop
Appendix G: Power BI Desktop
Appendix H: Tableau Prep
Appendix H: Tableau Prep
Appendix I: Tableau Desktop
Appendix I: Tableau Desktop
Appendix J: Data Dictionaries
Data Dictionaries
Dillard’s Department Store
Sláinte
LendingClub
College Scorecard
Oklahoma Purchase Card
S&P100
Avalara
Glossary
People also search for ISE Data Analytics for Accounting 3rd:
introduction to data analytics for accounting ise
is data analytics good for accounting
how is data analytics used in accounting
use of data analytics
data analytics for accountants
Tags:
ISE Data,Analytics,Accounting,Vernon Richardson Professor
You may also like…
Business & Economics - Accounting
Business & Economics - Mathematical Economics
Business & Economics - Accounting
Computers - Information Systems
Accounting Information Systems, 4e ISE 4th Edition Vernon J. Richardson
Business & Economics - Accounting
Computers - Organization and Data Processing
Business & Economics - Accounting


