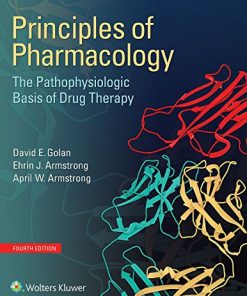
(EBook PDF) Principles of Pharmacology The Pathophysiologic Basis of Drug Therapy 4th Edition by David Golan 1496327063 9781496327062 full chapters
$50.00 Original price was: $50.00.$25.00Current price is: $25.00.
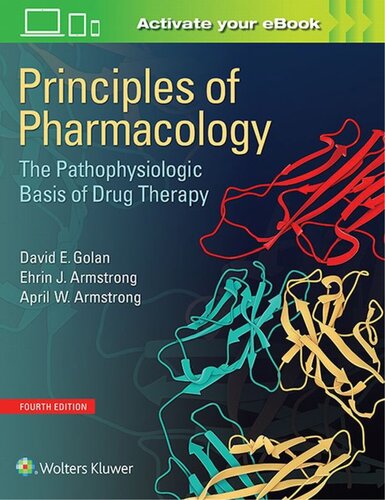
Principles of Pharmacology: The Pathophysiologic Basis of Drug Therapy 4th Edition by David E. Golan – Ebook PDF Instant Download/DeliveryISBN: 1496327063, 9781496327062
Full download Principles of Pharmacology: The Pathophysiologic Basis of Drug Therapy 4th Edition after payment.
Product details:
ISBN-10 : 1496327063
ISBN-13 : 9781496327062
Author: David Golan
Highly regarded by both students and instructors, Principles of Pharmacology: The Pathophysiologic Basis of Drug Therapy, 4th Edition, offers an integrated mechanism-based and systems-based approach to contemporary pharmacology and drug development.
Principles of Pharmacology: The Pathophysiologic Basis of Drug Therapy 4th Table of contents:
I: Fundamental Principles of Pharmacology
1: Drug–Receptor Interactions
INTRODUCTION
CONFORMATION AND CHEMISTRY OF DRUGS AND RECEPTORS
FIGURE 1-1. Levels of protein structure.
CASE
Questions
TABLE 1-1: Relative Strength of Bonds between Receptors and Drugs
FIGURE 1-2. Structural basis of specific enzyme inhibition: imatinib interaction with the BCR-Abl kinase.
Impact of Drug Binding on the Receptor
Membrane Effects on Drug–Receptor Interactions
MOLECULAR AND CELLULAR DETERMINANTS OF DRUG SELECTIVITY
MAJOR TYPES OF DRUG RECEPTORS
FIGURE 1-3. Major types of interactions between drugs and receptors.
TABLE 1-2: Six Major Types of Drug–Receptor Interactions
Transmembrane Ion Channels
TABLE 1-3: Three Major Types of Transmembrane Ion Channels
FIGURE 1-4. Ligand-gated nicotinic acetylcholine receptor.
Transmembrane G Protein-Coupled Receptors
FIGURE 1-5. Receptor-mediated activation of a G protein and the resultant effector interaction.
FIGURE 1-6. Activation of adenylyl cyclase (AC) and phospholipase C (PLC) by G proteins.
TABLE 1-4: The Major G Protein Families and Examples of Their Actions
TABLE 1-5: Tissue Localization and Action of β-Adrenergic Receptors
Transmembrane Receptors with Linked Enzymatic Domains
FIGURE 1-7. Major types of transmembrane receptors with linked enzymatic domains.
Receptor Tyrosine Kinases
Receptor Tyrosine Phosphatases
Tyrosine Kinase-Associated Receptors
Receptor Serine/Threonine Kinases
Receptor Guanylyl Cyclases
Intracellular Receptors
Intracellular Enzymes and Signal Transduction Molecules
Transcription Factors
FIGURE 1-8. Lipophilic molecule binding to an intracellular transcription factor.
Structural Proteins
Nucleic Acids
Extracellular Targets
Cell Surface Adhesion Receptors
PROCESSING OF SIGNALS RESULTING FROM DRUG–RECEPTOR INTERACTIONS
FIGURE 1-9. Signaling convergence of two receptors.
CELLULAR REGULATION OF DRUG–RECEPTOR INTERACTIONS
FIGURE 1-10. β-Adrenergic receptor regulation.
TABLE 1-6: Mechanisms of Receptor Regulation
DRUGS THAT DO NOT FIT THE DRUG–RECEPTOR MODEL
CONCLUSION AND FUTURE DIRECTIONS
Acknowledgment
Suggested Reading
2: Pharmacodynamics
INTRODUCTION
DRUG–RECEPTOR BINDING
CASE
Questions
FIGURE 2-1. Ligand–receptor binding curves.
DOSE–RESPONSE RELATIONSHIPS
Graded Dose–Response Relationships
FIGURE 2-2. Graded dose–response curves.
Quantal Dose–Response Relationships
FIGURE 2-3. Quantal dose–response curves.
DRUG–RECEPTOR INTERACTIONS
Agonists
Antagonists
FIGURE 2-4. Antagonist classification.
FIGURE 2-5. Types of receptor antagonists.
Competitive Receptor Antagonists
FIGURE 2-6. Antagonist effects on the agonist dose–response relationship.
Noncompetitive Receptor Antagonists
Nonreceptor Antagonists
Partial Agonists
FIGURE 2-7. Full and partial agonist dose–response curves.
Inverse Agonists
Spare Receptors
FIGURE 2-8. Comparison between a drug–receptor binding curve and a dose–response curve in the presence of spare receptors.
FIGURE 2-9. Effect of a noncompetitive antagonist on the agonist dose–response curve in the presence of spare receptors.
CONCEPTS IN THERAPEUTICS
Therapeutic Index and Therapeutic Window
CONCLUSION AND FUTURE DIRECTIONS
TABLE 2-1: Summary of Agonist and Antagonist Action
CLASSES OF AGONISTS
CLASSES OF ANTAGONISTS
Acknowledgment
Suggested Reading
3: Pharmacokinetics
INTRODUCTION
FIGURE 3-1. Drug absorption, distribution, metabolism, and excretion (ADME).
PHYSIOLOGIC BARRIERS
CASE
Questions
Biological Membranes
Traversing the Membrane
Membrane Diffusion
FIGURE 3-2. pH trapping across lipid bilayers.
Central Nervous System
ABSORPTION
FIGURE 3-3. Bioavailability after administration of a single dose of drug.
FIGURE 3-4. Effect of rate of absorption on peak plasma concentration of drug and on duration of drug action.
Administration Routes and Rationale
TABLE 3-1: Routes of Drug Administration
Enteral
Parenteral
TABLE 3-2: Routes of Parenteral Drug Administration
Mucous Membrane
Transdermal
Local, Regional, and Systemic Factors Affecting Absorption
DISTRIBUTION
TABLE 3-3: Drug Distribution to Different Body Compartments
TABLE 3-4: Total and Weight-Normalized Tissue Blood Flow in an Adult
Volume of Distribution
Plasma Protein Binding
FIGURE 3-5. Protein binding and drug trapping.
Modeling the Kinetics of Drug Distribution
FIGURE 3-6. Drug distribution and elimination after intravenous administration.
FIGURE 3-7. Schematic model of drug distribution and elimination.
FIGURE 3-8. Four-compartment model of drug distribution.
METABOLISM
Oxidation/Reduction Reactions
Conjugation/Hydrolysis Reactions
EXCRETION
Renal Excretion
FIGURE 3-9. Drug filtration, secretion, and reabsorption in the kidney.
Biliary Excretion
CLINICAL APPLICATIONS OF PHARMACOKINETICS
Clearance
Metabolism and Excretion Kinetics
FIGURE 3-10. Michaelis-Menten kinetics.
Half-Life
Factors Altering Half-Life
TABLE 3-5: Factors Affecting Drug Half-Life
Therapeutic Dosing and Frequency
FIGURE 3-11. Therapeutic, subtherapeutic, and toxic drug dosing.
FIGURE 3-12. Fluctuations in steady-state drug concentration depend on dosing frequency.
Loading Dose
Maintenance Dose
FIGURE 3-13. Saturation kinetics and drug toxicity.
CONCLUSION AND FUTURE DIRECTIONS
TABLE 3-6: Summary of Key Pharmacokinetic Relationships
Acknowledgment
Suggested Reading
4: Drug Metabolism
INTRODUCTION
SITES OF DRUG METABOLISM
FIGURE 4-1. Portal circulation and the first-pass effect.
CASE
Questions
PATHWAYS OF DRUG METABOLISM
TABLE 4-1: Oxidation and Reduction Reactions
TABLE 4-2: Hydrolysis and Conjugation Reactions
Oxidation/Reduction Reactions
FIGURE 4-2. Cytochrome P450-mediated drug oxidation.
Conjugation/Hydrolysis Reactions
FIGURE 4-3. Conjugation reactions.
Drug Transport
Induction and Inhibition
FIGURE 4-4. Conceptualization of P450 induction and inhibition.
TABLE 4-3: Some Pharmacologic Substrates, Inhibitors, and Inducers of Cytochrome P450 Enzymes
Active and Toxic Metabolites
INDIVIDUAL FACTORS AFFECTING DRUG METABOLISM
Pharmacogenomics
Race and Ethnicity
Age and Gender
Diet and Environment
Metabolic Drug Interactions
Diseases Affecting Drug Metabolism
CONCLUSION AND FUTURE DIRECTIONS
Acknowledgment
Suggested Reading
5: Drug Transporters
INTRODUCTION
FIGURE 5-1. Major transporters of drugs and endogenous compounds in the intestine, kidney, liver, and blood–brain barrier.
CASE
Questions
UPTAKE AND EFFLUX TRANSPORTERS
FIGURE 5-2. Simple diffusion.
FIGURE 5-3. Passive transport.
FIGURE 5-4. Active transport.
Uptake Transporters
Organic Anion-Transporting Polypeptide (OATP) Family
TABLE 5-1: Uptake Transporters
Organic Anion Transporter (OAT) Family
Organic Cation Transporter (OCT) Family
Bile Acid Transporters
Peptide Transporter (PEPT) Family
Concentrative and Equilibrative Nucleoside Transporter (CNT and ENT) Families
Glucose Transporters
Efflux Transporters
ATP-Binding Cassette (ABC) Transporter Family
P-Glycoprotein and Bile Salt Export Pump (ABCB Family)
TABLE 5-2: Efflux Transporters
Multidrug Resistance-Associated Proteins (ABCC Family)
Breast Cancer Resistance Protein (ABCG Family)
ABCA and ABCD Families
Solute Carrier (SLC) Family
Multi-Antimicrobial Extrusion Protein (MATE) Family
CLINICAL PERSPECTIVES ON DRUG TRANSPORTERS
Drug–Drug Interactions
TABLE 5-3: Clinically Observed Drug–Drug Interactions Due to Transporters
Drug Interference with Endogenous Metabolite Trafficking
TABLE 5-4: Adverse Drug Reactions Due to Transporter–Drug Interactions
Pharmacogenomics
INTEGRATION OF DRUG TRANSPORTER SCIENCE INTO DRUG DISCOVERY AND DEVELOPMENT
BOX 5-1: Drug Development Case
FIGURE A. Accumulation of four lead HMG-CoA reductase inhibitors in suspended rat hepatocytes over 30 seconds.
FIGURE B. In vitro and in vivo data for Compounds A, B, C, and D after oral administration of 30 mg/kg in rats.
Questions and Discussion
CONCLUSION AND FUTURE DIRECTIONS
Suggested Reading
6: Drug Toxicity
INTRODUCTION
CASE
Questions
MECHANISMS OF DRUG TOXICITY
FIGURE 6-1. On-target and off-target adverse drug effects.
FIGURE 6-2. Mechanisms of hypersensitivity reactions.
On-Target Effects
Off-Target Effects
BOX 6-1: Application to Therapeutic Decision Making: Drugs in Pregnancy
Category A
Category B
Category C
Category D
Category X
Idiosyncratic Toxicity
CONTEXTS OF DRUG TOXICITY
Drug Overdose
Drug–Drug Interactions
Pharmacokinetic Drug–Drug Interactions
Pharmacodynamic Drug–Drug Interactions
Drug–Herb Interactions
Cellular Mechanisms of Toxicity: Apoptosis and Necrosis
FIGURE 6-3. Subtoxic and toxic damage to hepatocytes in response to moderate and high doses of drug.
Organ and Tissue Toxicity
Harmful Immune Responses and Immunotoxicity
TABLE 6-1: Types of Hypersensitivity Reactions
Drug-Induced Hepatotoxicity
FIGURE 6-4. Mechanism of acetaminophen poisoning and treatment.
Drug-Induced Renal Toxicity
Drug-Induced Neurotoxicity
Drug-Induced Skeletal Muscle Toxicity
Drug-Induced Cardiovascular Toxicity
Drug-Induced Pulmonary Toxicity
Carcinogenesis Due to Drug Therapy
Teratogenesis Due to Drug Therapy
PRINCIPLES FOR TREATING PATIENTS WITH DRUG-INDUCED TOXICITY
TOWARD EARLY DETECTION AND PREDICTION OF DRUG TOXICITY
CONCLUSION AND FUTURE DIRECTIONS
TABLE 6-2: Online Resources for Information on Drug Toxicity
Acknowledgment
Suggested Reading
7: Pharmacogenomics
INTRODUCTION
PHYSIOLOGY
Genomic Variation and Pharmacogenomics
CASE
Questions
PHARMACOLOGY
Variation in Enzymes of Drug Metabolism: Pharmacokinetics
TABLE 7-1: Examples of Genetic Polymorphisms and Drug Metabolism
FIGURE 7-1. CYP2D6 pharmacogenetics.
FIGURE 7-2. Tamoxifen pharmacogenetics.
FIGURE 7-3. TPMT pharmacogenetics.
Variation in Drug Targets: Pharmacodynamics
TABLE 7-2: Examples of Genetic Polymorphisms and Drug Targets
Pathway-Based Pharmacogenetics-Pharmacogenomics
FIGURE 7-4. Warfarin pharmacokinetics and pharmacodynamics.
Role of Epigenetics in Pharmacogenetics-Pharmacogenomics
FIGURE 7-5. Epigenetic control of absorption, distribution, metabolism, and excretion (ADME) genes.
Modern Pharmacogenomics
Pharmacogenomics and Regulatory Science
CONCLUSION AND FUTURE DIRECTIONS
Acknowledgment
Suggested Reading
II: Principles of Neuropharmacology
IIA: Fundamental Principles of Neuropharmacology
8: Principles of Cellular Excitability and Electrochemical Transmission
INTRODUCTION
CELLULAR EXCITABILITY
CASE
Questions
Ohm’s Law
FIGURE 8-1. Ohm’s law.
Ion Channels
FIGURE 8-2. Electric circuit model of the cell membrane.
Channel Selectivity, the Nernst Equation, and the Resting Potential
FIGURE 8-3. Electrochemical basis of the resting membrane potential.
TABLE 8-1: Nernst Equilibrium Potentials for Major Ions
FIGURE 8-4. Relative contribution of K+ and Na+ to the resting membrane potential.
The Goldman Equation
The Action Potential
FIGURE 8-5. The action potential.
FIGURE 8-6. Voltage dependence of channel activity.
FIGURE 8-7. Time course of voltage-dependent Na+ and K+ conductances.
PHARMACOLOGY OF ION CHANNELS
ELECTROCHEMICAL TRANSMISSION
FIGURE 8-8. Steps in synaptic transmission.
Synaptic Vesicle Regulation
FIGURE 8-9. Current model of neurotransmitter release.
Postsynaptic Receptors
Transmitter Metabolism and Reuptake
CONCLUSION AND FUTURE DIRECTIONS
Acknowledgment
Suggested Reading
9: Principles of Nervous System Physiology and Pharmacology
INTRODUCTION
NEUROANATOMY
Anatomy of the Peripheral Nervous System
FIGURE 9-1. Organization of the peripheral nervous system.
CASE
Questions
Autonomic Nervous System
Anatomy of the Sympathetic Nervous System
FIGURE 9-2. Patterns of sympathetic and parasympathetic innervation.
Anatomy of the Parasympathetic Nervous System
Peripheral Motor and Sensory Systems
Anatomy of the Central Nervous System
FIGURE 9-3. Anatomic organization of the central nervous system.
Cerebrum
FIGURE 9-4. Anatomy of the cerebral hemispheres.
Diencephalon
Cerebellum
FIGURE 9-5. Anatomy of the cerebellum.
Brainstem
Spinal Cord
FIGURE 9-6. Anatomy of the spinal cord.
Cellular Organization of the Nervous System
FIGURE 9-7. Cellular organization of the central nervous system.
Long-Tract Neuronal Organization
Local Circuit Neuronal Organization
Single-Source Divergent Neuronal Organization
TABLE 9-1: Single-Source Divergent Neuronal Systems
FIGURE 9-8. Diffuse neuronal systems.
NEUROPHYSIOLOGY
Neurotransmitters
FIGURE 9-9. Neurotransmitters in the peripheral nervous system (A-C).
TABLE 9-2: Small Molecule Neurotransmitters in the Central Nervous System
FIGURE 9-10. Structures of the small molecule neurotransmitters.
Amino Acid Neurotransmitters
Biogenic Amines
FIGURE 9-11. Synthesis of catecholamines.
FIGURE 9-12. Synthesis of 5-hydroxytryptamine (serotonin).
Other Small Molecule Neurotransmitters
Neuropeptides
The Blood–Brain Barrier
FIGURE 9-13. Features of capillaries in the central nervous system compared to the peripheral vasculature.
FIGURE 9-14. Relative ability of compounds to enter the brain from the blood.
CONCLUSION AND FUTURE DIRECTIONS
Suggested Reading
IIB: Principles of Autonomic and Peripheral Nervous System Pharmacology
10: Cholinergic Pharmacology
INTRODUCTION
BIOCHEMISTRY AND PHYSIOLOGY OF CHOLINERGIC NEUROTRANSMISSION
CASE
Questions
Synthesis of Acetylcholine
FIGURE 10-1. Acetylcholine synthesis, storage, release, and degradation pathways and pharmacologic agents that act on these pathways.
Storage and Release of Acetylcholine
Cholinergic Receptors
Muscarinic Receptors
TABLE 10-1: Characteristics of Cholinergic Receptor Subtypes
Nicotinic Receptors
FIGURE 10-2. Structural biology of the nicotinic acetylcholine receptor.
FIGURE 10-3. Kinetics of nicotinic acetylcholine receptor binding and channel opening.
Degradation of Acetylcholine
Physiologic Effects of Cholinergic Transmission
Neuromuscular Junction
FIGURE 10-4. The neuromuscular junction (NMJ).
FIGURE 10-5. Quantal release of acetylcholine and muscle contraction.
FIGURE 10-6. Tetanic fade and the effects of hexamethonium.
Autonomic Effects
FIGURE 10-7. Four types of synaptic signals in an autonomic ganglion.
TABLE 10-2: Effects of Autonomic Ganglionic Blockade on Tissues
TABLE 10-3: Effects of Acetylcholine on Muscarinic Receptors in Peripheral Tissues
CNS Effects
The Non-Neuronal Cholinergic System (NNCS)
PHARMACOLOGIC CLASSES AND AGENTS
Inhibitors of Acetylcholine Synthesis, Storage, and Release
Acetylcholinesterase Inhibitors
Structural Classes
FIGURE 10-8. Structural classes of acetylcholinesterase inhibitors.
Clinical Applications
TABLE 10-4: Pharmacokinetic and Mechanistic Characteristics of Donepezil, Rivastigmine, Rivastigmine Transdermal Patch, Galantamine, and Galantamine ER
Receptor Agonists
Muscarinic Receptor Agonists
FIGURE 10-9. Structural classes of muscarinic receptor agonists.
TABLE 10-5: Relative Pharmacologic Properties of Choline Esters
Nicotinic Receptor Agonists
TABLE 10-6: Comparison of Nondepolarizing and Depolarizing NMJ-Blocking Agents
BOX 10-1: Cholinergic Toxicity
Muscarinic Cholinergic Toxicity
Nicotinic Cholinergic Toxicity
Cholinesterase Inhibitor Poisoning
Receptor Antagonists
Muscarinic Receptor Antagonists
BOX 10-2: Potential Adverse Effects of Drugs with Anticholinergic Properties in Geriatric and Cognitively Impaired Patients
TABLE 10-7: Medications with Anticholinergic Properties That Can Be Inappropriate for Use by Cognitively Impaired Older Adults (2012 AGS Beers Criteria)
Nicotinic Receptor Antagonists
CONCLUSION AND FUTURE DIRECTIONS
Suggested Reading
DRUG SUMMARY TABLE: CHAPTER 10 Cholinergic Pharmacology
11: Adrenergic Pharmacology
INTRODUCTION
BIOCHEMISTRY AND PHYSIOLOGY OF ADRENERGIC FUNCTION
Catecholamine Synthesis, Storage, and Release
FIGURE 11-1. Catecholamine synthesis, storage, release, and reuptake pathways.
CASE
Questions
FIGURE 11-2. Mechanisms of action of cocaine and reserpine.
Reuptake and Metabolism of Catecholamines
FIGURE 11-3. Norepinephrine metabolism.
Catecholamine Receptors
TABLE 11-1: Adrenoceptor Actions
α1- and α2-Adrenoceptors
β-Adrenoceptors
Regulation of Receptor Response
Physiologic and Pharmacologic Effects of Endogenous Catecholamines
Epinephrine
Norepinephrine
Dopamine
PHARMACOLOGIC CLASSES AND AGENTS
Inhibitors of Catecholamine Synthesis
Inhibitors of Catecholamine Storage
FIGURE 11-4. Acute and chronic effects of indirect sympathomimetics.
Inhibitors of Catecholamine Reuptake
Inhibitors of Catecholamine Metabolism
Receptor Agonists
α-Adrenergic Agonists
β-Adrenergic Agonists
Receptor Antagonists
α-Adrenergic Antagonists
β-Adrenergic Antagonists
TABLE 11-2: Selectivity of Some β-Adrenoceptor Antagonists
CONCLUSION AND FUTURE DIRECTIONS
Acknowledgment
Suggested Reading
DRUG SUMMARY TABLE: CHAPTER 11 Adrenergic Pharmacology
12: Local Anesthetic Pharmacology
INTRODUCTION
PHYSIOLOGY OF NOCICEPTION
FIGURE 12-1. Nociceptor activation.
CASE
Questions
Transmission of Pain Sensation
TABLE 12-1: Types of Peripheral Nerve Fibers
First Pain and Second Pain
FIGURE 12-2. First and second pain.
Pain Perception
FIGURE 12-3. Pain pathways.
Analgesia and Anesthesia
PHARMACOLOGIC CLASSES AND AGENTS
Molecular Determinants of Local Anesthetic Action
FIGURE 12-4. Prototypical local anesthetics.
Aromatic Group
FIGURE 12-5. Local anesthetic hydrophobicity, diffusion, and binding.
Amine Group
Mechanism of Action of Local Anesthetics
Anatomic Factors in Impulse Blockade
FIGURE 12-6. Peripheral nerve anatomy.
Voltage-Gated Sodium Channel
FIGURE 12-7. Local anesthetic binding to different conformations (states) of the sodium channel.
Modulated Receptor Hypothesis
TABLE 12-2: Modulated Receptor Hypothesis
Tonic and Phasic Inhibition
FIGURE 12-8. Tonic and phasic (use-dependent) inhibition.
Other Receptors for Local Anesthetics
Pharmacokinetics of Local Anesthetics
Systemic Absorption
Distribution
Metabolism and Excretion
Administration of Local Anesthetics
Topical Anesthesia
Infiltration Anesthesia
BOX 12-1: Local Anesthetics in Dentistry
Peripheral Nerve Blockade
Central Nerve Blockade
Intravenous Regional and Systemic Anesthesia
Major Toxicities
Individual Agents
Ester-Linked Local Anesthetics
Procaine
Tetracaine
Cocaine
Amide-Linked Local Anesthetics
Lidocaine and Prilocaine
Bupivacaine
Articaine
EMLA
CONCLUSION AND FUTURE DIRECTIONS
Suggested Reading
DRUG SUMMARY TABLE: CHAPTER 12 Local Anesthetic Pharmacology
People also search for Principles of Pharmacology: The Pathophysiologic Basis of Drug Therapy 4th:
principles.of pharmacology the pathophysiologic
principles of pathophysiology and pharmacology
what are the principles of pharmacology
basic principles of pharmacology
principles of general pharmacology
Tags:
Principles,Pharmacology,Pathophysiologic,Drug Therapy,David Golan
You may also like…
Chemistry - Organic Chemistry
Basic Principles of Drug Discovery and Development 2nd Edition
Uncategorized
Uncategorized
Principles of Pharmacology: The Pathophysiologic Basis of Drug Therapy 4th Edition, (Ebook PDF)
Medicine
Anti-Aging Drug Discovery on the Basis of Hallmarks of Aging Sandeep 1st Edition Kumar Singh


